What we can learn from the development of the stock market in 2020
The year 2020 will remain in the memory of us all. The Corona pandemic suddenly turned our lives upside down. With the first measures to combat the pandemic in March of last year, the world seemed to have fallen apart. Until then, hardly anyone could have imagined that politics would be forced to intervene so deeply in people's freedom of movement.

The year 2020 will remain in the memory of us all. The Corona pandemic suddenly turned our lives upside down. With the first measures to combat the pandemic in March of last year, the world seemed to have fallen apart. Until then, hardly anyone could have imagined that politics would be forced to intervene so deeply in people's freedom of movement. The omnipresence of a highly contagious, largely unknown virus in everyday human interaction suddenly confronted us with a new reality. At the same time, it did not take much imagination to envision the enormous economic consequences of the worldwide lockdowns and shutdowns.
"Processing" the pandemic in our minds was and is a challenge. Since end of February 2020, the media have been dominated by reports, analyses and assessments surrounding the global health crisis. At times, it has not been easy to understand and classify the developments and to recognize consequences for our future. Although – in principle – starting points for understanding what was happening could have been derived from the time of the Spanish flu about 100 years ago, we felt that we were all in a confusing new territory.
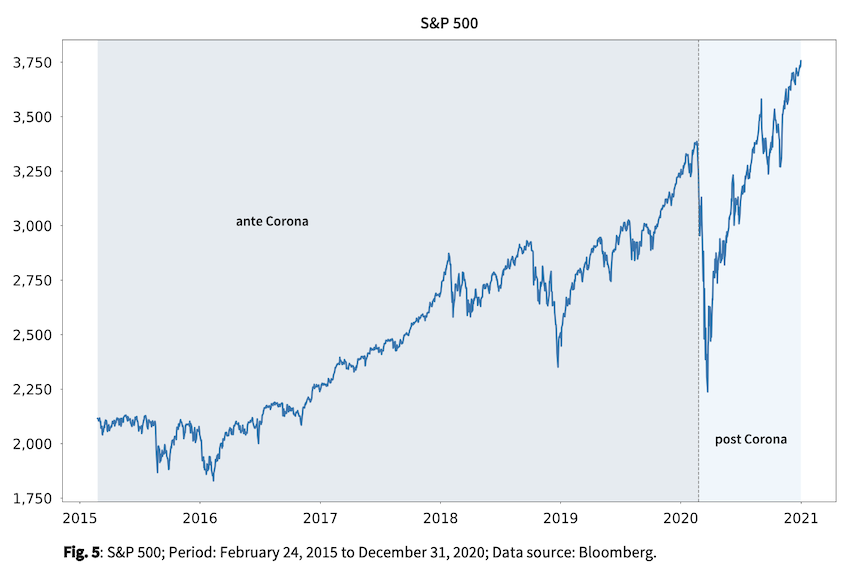
A well-founded medium- and long-term assessment of the pandemic and its consequences was almost always provided by the global capital markets. After a significant correction at the beginning of the pandemic in late winter, prices on the global stock markets followed a positive trend for the rest of the year. The S&P 500 lost more than 30% in February and March but had already recovered the loss by the summer. Given the crisis of historic proportions caused by the global spread of viruses, the rapid recovery in stock prices came as something of a surprise to some market participants. As is well known, the driving factors behind the price advances included the ultra-expansive monetary policy of the central banks, the gigantic fiscal rescue packages in many industrialized countries, and the structural demand for equities as a real asset class. However, it is imperative to add here that without the fundamental optimism of investors, in other words, the robust positive sentiment after the initial shock, the measures taken by institutions would have failed to achieve their effect in the markets. The stock markets very quickly and objectively anticipated that humanity would contain the spread of the virus within a foreseeable period of time, and that a free life and economic growth would then gradually become possible again. Since we are indeed already seeing a light at the end of the tunnel at the beginning of 2021 due to the availability of several approved vaccines against Covid-19, the pricing on the stock markets over the course of the past year must once again be credited with a high quality of information.
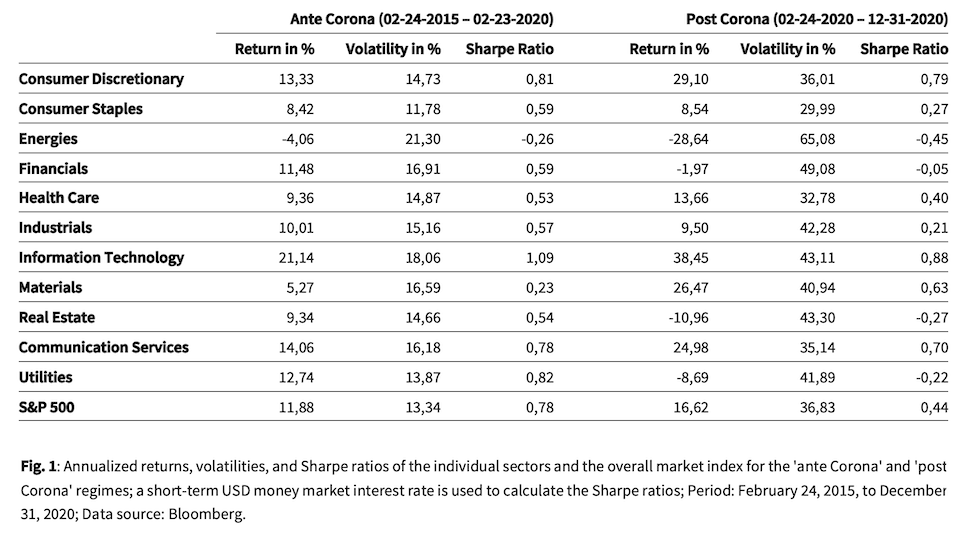
However, market participants have strongly differentiated their demand for stocks after the Corona shock. This emerges from an analysis of the performance of the various stock market sectors 'post Corona' compared with the preceding five years 'ante Corona'. For our examination, we have chosen February 24, 2020 as the trading day when market participants started to price the Corona pandemic into their decisions (1). In the appendix the performance chart of the S&P 500 over the five-year 'ante Corona' period from February 24, 2015 to February 23, 2020 and the intra-year 'post Corona' period from February 24 to December 31 of last year is shown. Figure 1 documents the annualized returns, volatilities and Sharpe ratios of the eleven sectors of the S&P 500 and the overall market index for these two periods (2). The calculated values support the notion that the stock market pandemic has initiated a new regime in terms of returns and volatilities, yet with widely differing effects in the various sectors.
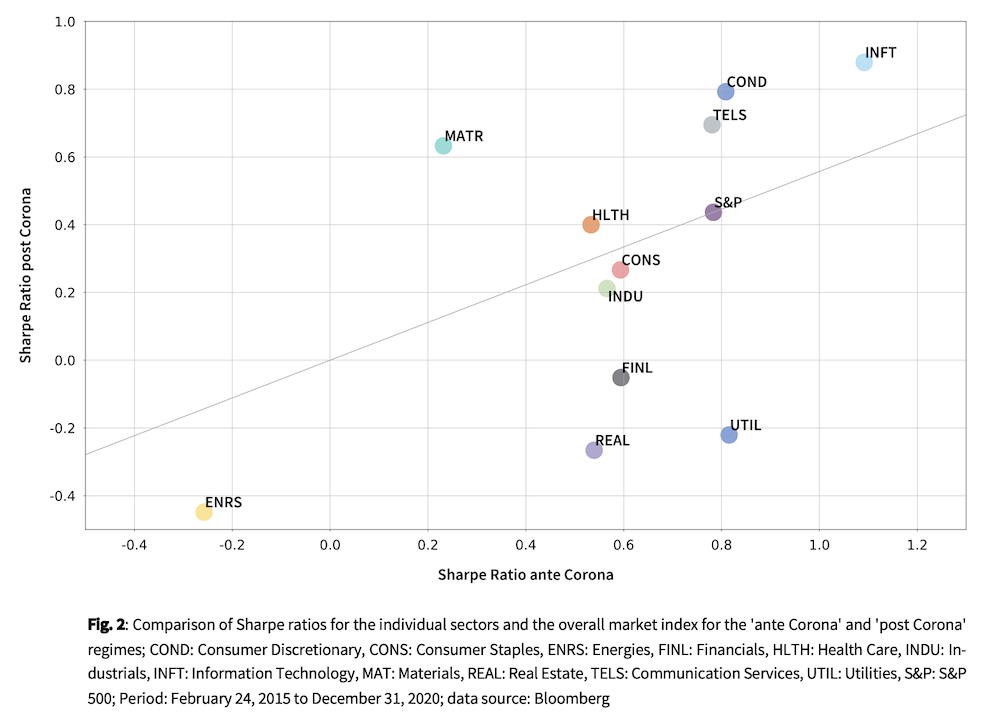
As the 'post Corona' period is characterized by significant market corrections and high volatility, we now look at risk-adjusted returns of the sectors to gain profound insights into the individual impact of the regime change. Figure 2 compares the Sharpe ratios of the sectors and the overall market index for the 'ante Corona' and 'post Corona' regimes. The anchor point for our analysis is the total market index: for the S&P 500, a Sharpe ratio of 0.44 'post Corona' compares to a Sharpe ratio of 0.78 'ante Corona'. Although the annualized return of 16.62% in the ‘post Corona’ Period under consideration is higher than the annualized return in the previous five years (average 11.88%), the Sharpe ratio is reduced due to the significantly higher volatility in the 'post Corona' period (36.82% vs. 12.34%). The line drawn in the figure visualizes this ratio of Sharpe ratios over the two regimes for the overall market.
Above the line are the sectors Materials, Health Care, Communication Services, Consumer Discretionary and Information Technology. Compared to the overall market, the Sharpe ratios of these sectors have changed positively with the regime change. Investors apparently attribute improved opportunities to the business models and markets of companies in these five sectors for the post-pandemic period. Compared with the market as a whole, the Sharpe ratios of the energy, real estate, industrial, financials, consumer staples and utilities sectors have deteriorated or deteriorated significantly. Thus, for companies in these sectors, investors tend to expect deterioration in business potentials in the new post-Corona reality. This simple look at risk-adjusted returns of U.S. sectors makes clear that equity markets are not only looking very far into the future in assessing the impact of the Corona pandemic, but also very differentiated.
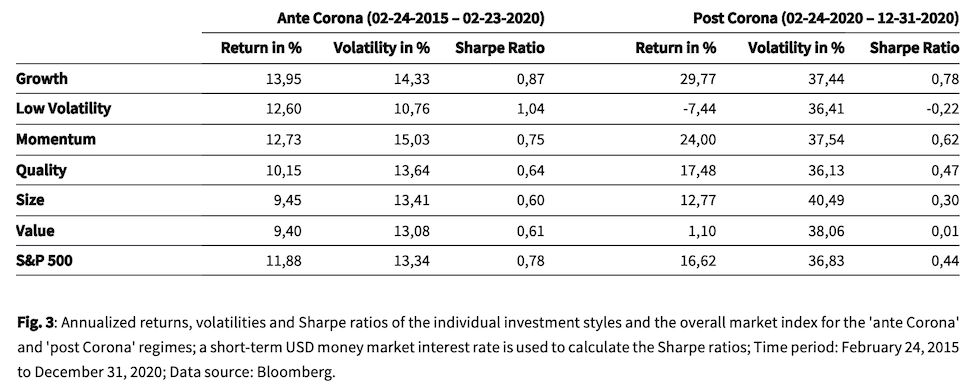
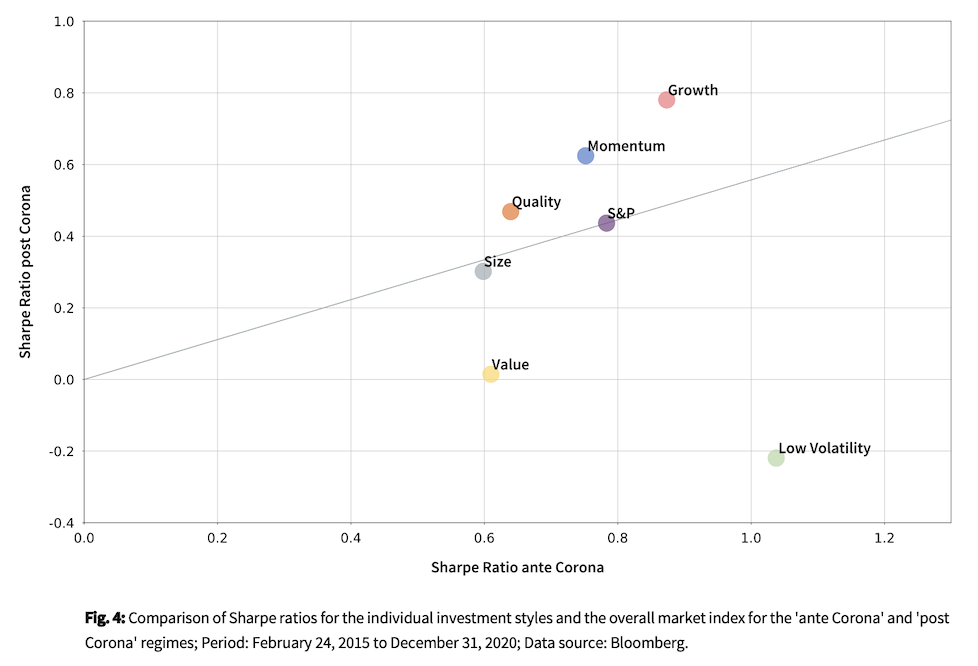
Figures 3 and 4 document the same analysis for the main factor-based investment styles in the stock market. Returns and volatilities also changed significantly for the six styles considered when entering the 'post Corona' regime. In the new regime, the Quality, Momentum, and Growth investment styles outperform the S&P 500 with respect to the absolute Sharpe Ratio as well as the relative change in the Sharpe Ratio over the regime shift. Size strategies have roughly maintained their position relative to the overall market over the regime shift, while the Value and especially Low Volatility investment styles have fallen sharply in absolute and relative terms. In the new regime, the Low Volatility strategy in particular does not seem to have found traction. These observations are by no means surprising and reinforce the finding that factor-based investment styles are regime-dependent and can deviate significantly from their long-term performance characteristics over short to medium-term periods.
Conclusion
In our first Market Insight of 2021, we have intentionally refrained from providing an (additional) "outlook" for the stock market year and from explaining our assessments in detail. The driving factors on the capital markets are well known. At the start of the new year, market participants' appetite for risk will again be stimulated particularly by the sustained ultra-expansive monetary policy, the enormous fiscal stimulus in the industrialized countries, the prospect of an imminent return of the USA as a reliable partner on the world stage, and the hope of an effective containment of the Corona virus, primarily through vaccinations. Risk appetite could be dampened by possible further virus mutations with corresponding consequences, the already inflated fundamental stock valuations in many market segments, more corporate bankruptcies than expected with more unemployment than anticipated, and a surprising rise in interest rates, for example in the USA. Against this background, volatility will continue to stay high. However, the positive sentiment in the equity markets seems to us to be quite robust.
With our simple analysis in this commentary, we would like to motivate people to always take careful note of the information processing in the markets. The year 2020 is a very good example of the power of stock market pricing processes, when it comes to resorting the world in a new, highly complex regime. Over the past year, equity markets have consistently given us certain nudges to look positively into the future far beyond the pandemic. At the beginning of 2021, we know that there are still very big challenges to overcome on the way back to a free life. However, we now have justified hope that we will succeed in doing so in the foreseeable future. The stock markets already offered us this perspective in the summer of 2020.
(1) On February 24, 2020, stock prices for risk-bearing assets began to slide massively. On February 26, the WHO reported more new infections outside China than inside for the first time, classified the risk as "very high" on February 28 and declared the epidemic as a pandemic on March 11.
(2) Sharpe ratios were also calculated for negative returns, although these cannot be interpreted meaningfully.
Author
Dr. Peter Oertmann | Chairman of the board
oertmann@ultramarin.ai
Appendix