Stock prices still robust despite major uncertainties - a simple look at the valuation mechanics on the markets
The MSCI World stock market index has risen by more than 2 % since the beginning of the year - despite the epochal uncertainties regarding the further course and the effective impact of the corona pandemic on the economy and society.

The MSCI World stock market index has risen by more than 2 % since the beginning of the year - despite the epochal uncertainties regarding the further course and the effective impact of the corona pandemic on the economy and society. At the same time, the price of gold has risen by almost 28 % and the price of oil (Brent) has fallen by 36 %. How can this be and how does it fit together? The current valuations on the stock markets are often seen as detached from the real data situation due to the deep traces of the pandemic already visible in the economy. In principle, we assume that the prices observable in markets reflect the expectations of market participants to a large extent efficiently. Nevertheless, the question arises as to how solid the foundation of the stock markets is in the current mixed situation. The following is a brief analysis of this question.
The good old Dividend Discount Model (DDM) is and will remain a solid basis for sorting out the various influences on stock prices. According to this model, the price of a stock corresponds to the present value of all expected dividend payments. Shareholders always look very far into the future, ultimately assuming an infinite dividend stream. If we assume a constant dividend growth and a constant discount factor in the DDM, the price of a stock can be written down as follows:

The formula can be read as follows: The current price of a stock (Pt) corresponds to the expected next dividend (Dt+1), divided by the difference between a constant discount factor (r) and a constant dividend growth factor (g). This simple fundamental description of the price of a stock is called the Gordon Growth Model (GGM), which is conceptually transferable to the overall market. However, it should be briefly noted that this model does not include possible share repurchases by companies, which of course also represent distributions to shareholders. However, this does not restrict our comments below.
The GGM provides a well-structured view of the "mechanics" of the stock market: the prices of stocks rise when the expected next dividends from companies rise or the discount factor for these dividends falls or the expected dividend growth increases - in each case ceteris paribus. In very simplified terms, the discount factor is determined by the interest rate of a risk-free investment and a risk premium. The latter results from the fact that the future dividends of companies can by no means be determined with certainty, but are dependent on business success in the economic environment. Expected dividends are therefore discounted in line with the risk. Within the conceptual framework of this fundamental understanding of the return drivers on the stock market, let us now take a brief look at the current situation.
As mentioned at the beginning, stock prices are currently higher than at the beginning of the year. The relationship between the expected next dividend payments from companies, expected dividend growth and the discount factor must therefore have improved in favor of rising stock prices despite the enormous burden of the pandemic. It is fairly certain that the aggregate dividend payments from companies will be significantly lower in the near future due to the global lockdowns during the first wave of the pandemic and the significant slump in demand in many industries. On the other hand, however, the massive governmental measures taken worldwide to stabilize the economy have obviously led to the fact that the expected long-term dividend growth is largely intact and the risk premium in the discount factor has remained stable. A significant influence on the discount factor is above all the monetary policy of the important central banks, which do everything possible to flood the markets with liquidity and shape the expectation that interest rates will remain very low for a very long time. It has been clear for a few days now that an ultra-loose monetary policy in the US is no longer an exception in times of crisis, but should become the rule. As part of a historic strategy adjustment, the US Federal Reserve has announced that it intends to continue its zero-interest rate policy until full employment prevails again in the US - without any particular consideration for the development of purchasing power in the country. The rigid inflation target in money supply management is replaced by an average inflation-targeting approach. In Japan, a zero-interest rate policy has long been the rule, and the ECB will probably adopt a similar concept. As a result, governments and central banks have so far "worked" very successfully on the denominator of the GGM in order to compensate for one of the biggest slumps in economic activity in the last 100 years in the long-term expectations of market participants.
The rapid return of confidence after the pandemic shock is also reflected in the market indicators with which we continuously monitor the risk appetite and expectations of market players. We rely on the highly liquid US capital markets and look at the US TED Spread, the US Credit Spread, the US TERM Spread and the CBOE volatility index VIX for the US equity market. The following illustration classifies these indicators statistically in the historical context of the last 10 years.
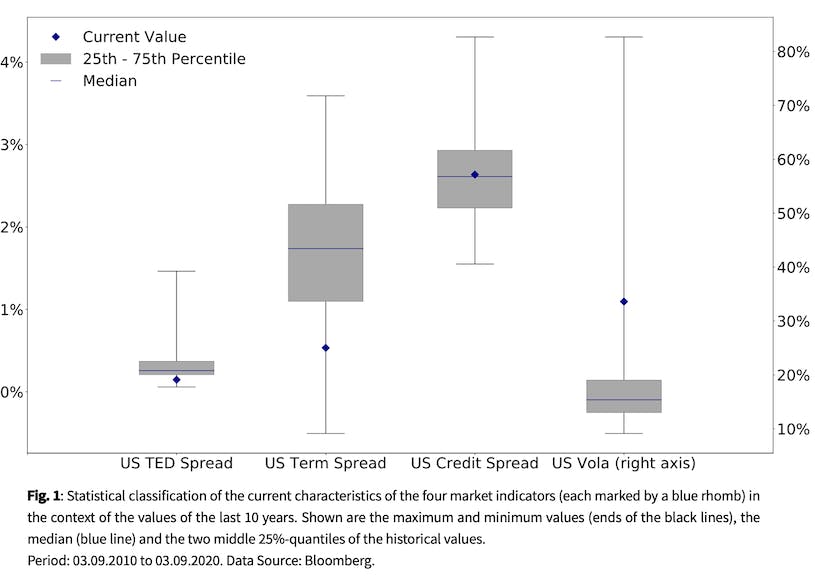
The US TED Spread, the difference between the interest rate for US Dollar financing in the Euro money market and the interest rate of a US Treasury Bill, each with a term of 3 months, corresponds to the prevailing confidence of market participants in the financial system and the general liquidity preference. The deep uncertainty in the markets in the course of March, accompanied by sudden concerns about the stability of the financial system, caused the TED spread to jump from a value close to zero to around 1.5 %. Currently (on September 3), the US TED spread of 0.15 % is in the lowest 25%-quantile of its historical value range. The immediate massive injection of liquidity by the central banks into the turbulent markets has quickly calmed the situation completely.
The US credit spread, represented by the difference between the interest rate on American corporate bonds in the BAA credit rating class and the interest rate on US Treasuries, reflects the assessment of the state of health of companies in the market. As a result of the pandemic shock, this spread reached a value of 4.3 % on March 20. Since then, it has tended to converge again and currently (on September 3) stands at 2.63 %. The risk premium is currently just above the median in the third 25%-quantile of its historical values. The rescue packages and measures with which governments are trying to get the economy through the crisis have quickly restored market participants' confidence.
The US TERM Spread, the difference between the interest rates on US Treasuries with 10 years to maturity and those with 3 months to maturity, is a proxy for economic expectations traded in the market. This spread continues to move sideways at a level of 0.53 % (on September 3) in the lowest 25%-quantile of its historical values. The persistently flat yield curve in the US reflects the considerable economic risks in the world's largest economy; according to a statement by the Business Cycle Dating Committee of the National Bureau of Economic Research (NBER), the US economy has officially been in recession since March 2020.
The VIX Index measures the expected volatility of the American stock index S&P 500, which is calculated by the Chicago Board Options Exchange (CBOE) as implied volatility from options transactions. Until February 21, the VIX was at levels between 15 % and 20 %, then jumped to levels around 80 % during March, indicating a market uncertainty of historic proportions. However, the massive uncertainty slowly subsided during the months of May, June and July. Currently (on September 3), the VIX is back at 33.60 %, but still in the top 25%-quantile of its historical value range. The market uncertainty is no longer extreme, but still significantly increased.
Conclusion
From the perspective of a simple dividend discount model, the fundamentally positive price development on the stock markets in difficult times is not so absurd. Market participants assume that the global health crisis can ultimately be overcome and that the economy will largely recover from the effects of the pandemic within a foreseeable period of time. Governments and central banks have laid the foundations to keep the long-term expectations of market participants regarding dividend growth intact and to stabilize or even reduce the discount factor. Our quantitative market indicators support the perception of a successful stabilization and brightening of players' expectations. In our last Market Insight, we discussed the strong discrepancy between value and growth stocks (especially technology stocks) in performance in the current year: This discrepancy clearly reflects investors' assessment of the opportunities for promising business models after the crisis. We also discussed in previous issues that in an environment of increasing debt, stock markets are being driven by a structural demand for real assets. These remain important drivers in the stock markets. In the current situation, however, there are also immense risks of negative economic developments, which must not be ignored in the investment process.
Author
Dr. Peter Oertmann | Chairman of the board
oertmann@ultramarin.ai