About the roller coaster of traded expectations
Since March 2020, the U.S. economy has officially been in a recession. The end of the U.S. economy's longest expansion with a duration of 128 months - since records began in 1854 - was announced by the Business Cycle Dating Committee of the National Bureau of Economic Research (NBER) on June 8, 2020.

Since March 2020, the U.S. economy has officially been in a recession. The end of the U.S. economy's longest expansion with a duration of 128 months - since records began in 1854 - was announced by the Business Cycle Dating Committee of the National Bureau of Economic Research (NBER) on June 8, 2020. The significant decline in economic activity in the United States (1), as it was in almost all industrialized countries at the same time, was triggered by the Corona pandemic and the measures taken to contain the spread of the virus.
The official classification of the prevailing phase in the business cycle of the world's largest economy by a renowned institution such as the NBER is without doubt important news. More relevant for investment decisions, however, is how the capital market "thinks" about the business cycle and what expectations are traded. Especially in the last year, there have been repeated controversial discussions about whether the capital markets still fit to the "reality" of the historical economic downturn. Therefore, we want to take a closer look at the traded economic expectations in the course of the eventful year 2020 until end of February 2021. In our analysis, we focus on four scientifically grounded state variables which can be used to determine the economic assessment of market participants and their associated risk appetite on a daily basis (2):
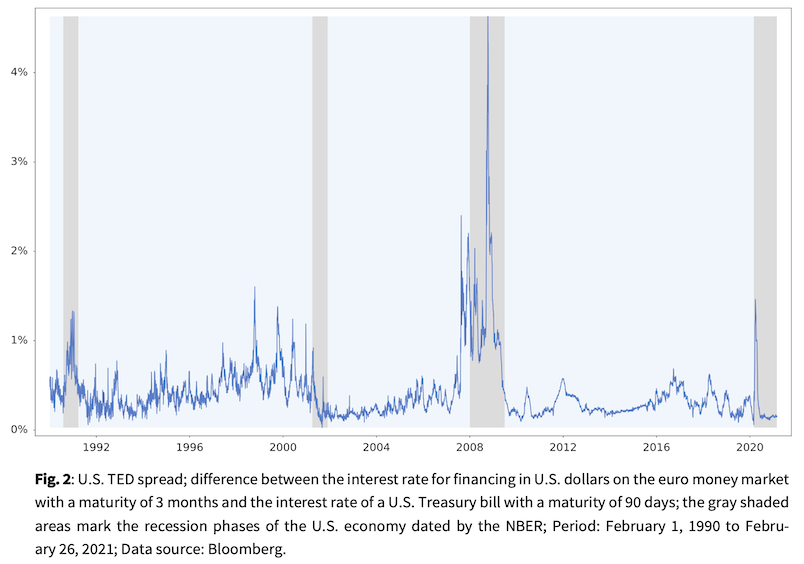
- U.S. TED (Treasury-Eurodollar) Spread: The difference between the interest rate on U.S. dollar borrowing or lending in the euro money market and the interest rate on a U.S. Treasury bill, each with a maturity of 3 months, corresponds to the prevailing confidence of market participants in the financial system and their general liquidity preference. The TED spread captures the interest rate premium for the counterparty risk of banks operating in the euro money market in in comparison to short-term U.S. government bonds that are considered risk-free. High TED spreads indicate stress in the financial system, accompanied by increased distrust among players.
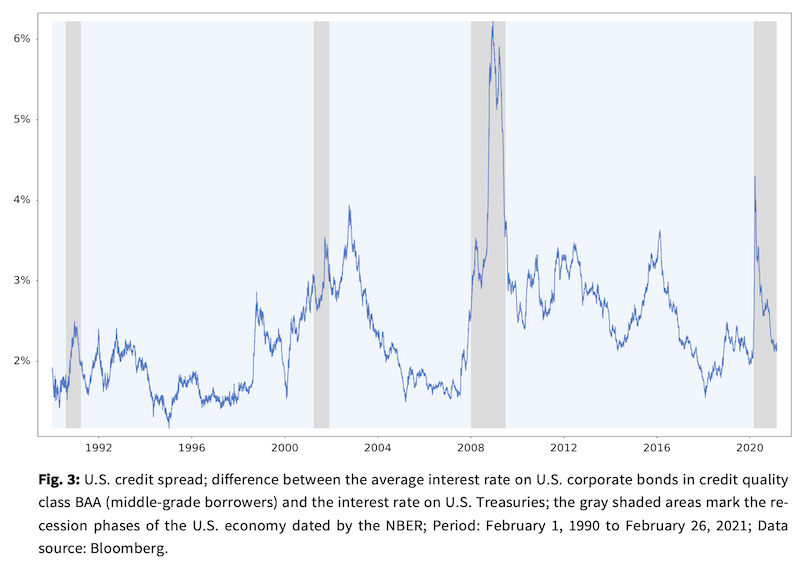
- U.S. credit spread: The difference between the interest rate on U.S. corporate bonds in the BAA credit rating category (medium-quality debtors) and the interest rate on U.S. Treasuries, which have the highest credit rating, reflects the confidence of market participants in the financial strength of companies and the health of the economy in an aggregated view. The credit spread is an interest rate premium demanded in the capital market for taking credit risks; for example, high credit spreads indicate increased insolvency risks.
- U.S. TERM Spread: The difference between interest rates on 10-year U.S. Treasuries and those with 3-month maturities is a proxy for economic expectations traded in the market. This interest rate differential varies with daily movements in the yield curve. A steep yield curve indicates positive economic expectations, while a flattening of the curve is often associated with recessionary trends or a recession.
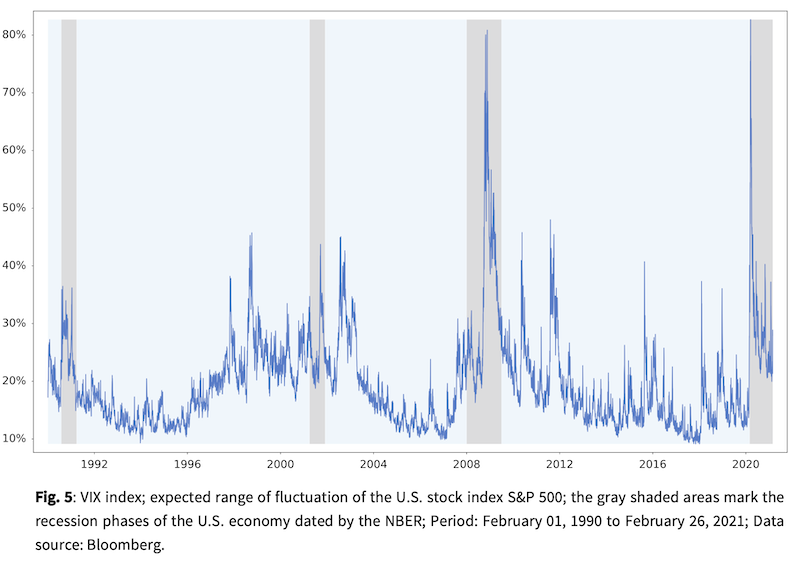
- VIX Index: The index calculated by the Chicago Board Options Exchange (CBOE) as implied volatility from options transactions reflects the expected volatility of the U.S. stock index S&P 500. High implied volatilities indicate high uncertainties among market participants with regard to valuations on the stock market.
Statistical analyses of historic value ranges of the four state variables over previous U.S. business cycles according to NBER classification form the basis for the assessment of the economic expectations traded in the capital market from the beginning of 2020 until today. We capture the daily observations of the U.S. TED spread, U.S. credit spread, and U.S. TERM spread, as well as the VIX index since January 1990, i.e. over the economic cycles of the past three decades. During this period, the NBER specified four recession phases of the U.S. economy, including the current one, as well as the expansion phases in between (3). The time series of the four indicators over the analyzed historical period are documented in figures 2 - 5 in the appendix.
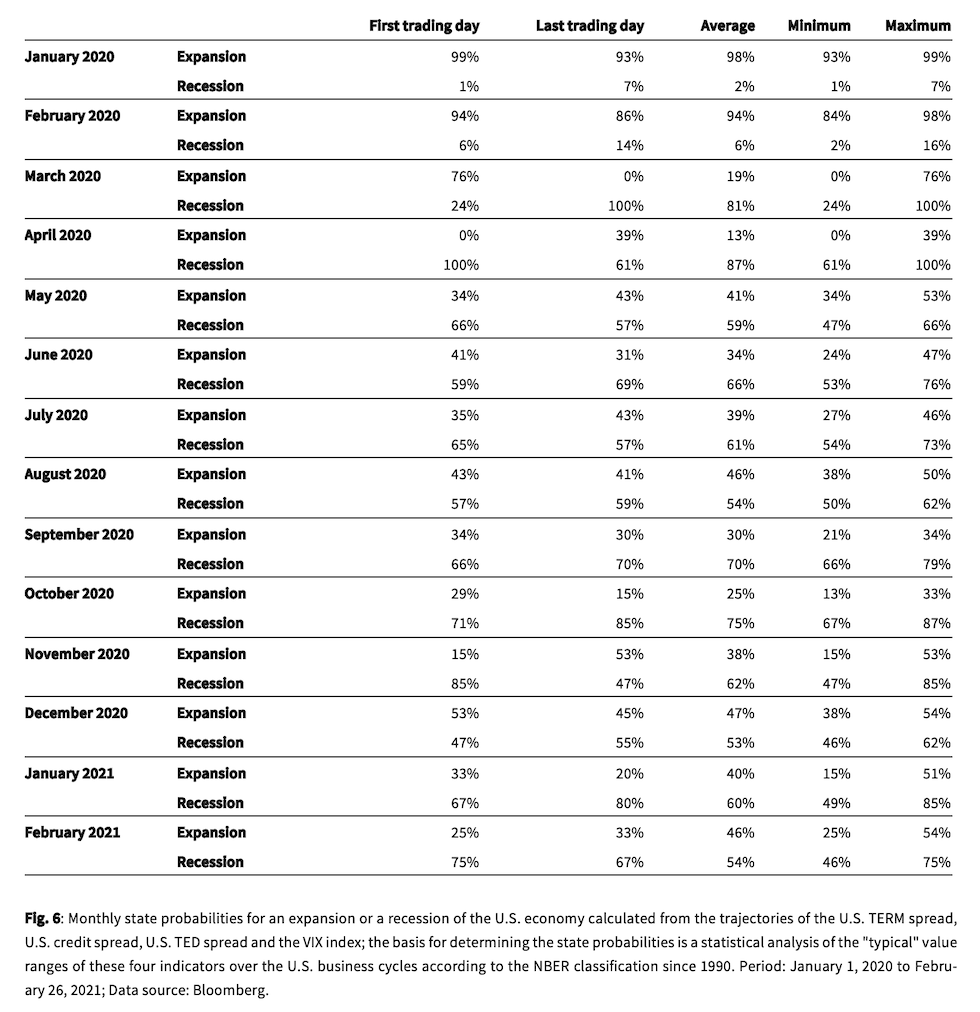
Based on the "typical" characteristics of the indicators in the historical expansion and recession phases, it is possible to calculate the probability for a current trading of a recession or expansion in the capital market. The state probabilities at a point in time t are calculated from the values of the four indicators at this point in time in relation to the values in previous expansion and recession phases over the period from t(0) to t’ < t, where t(0) marks the beginning of the analysis period, which is January 1990. Since two alternative states are possible in each case - expansion or recession - the state probabilities at each point in time add up to 100%.
Our analysis focuses on these state probabilities in the turbulent 2020 and the current year. Figure 1 shows the evolution of state probabilities for a recession and expansion over that period calculated from the four indicators. The Table in the appendix documents some details on the state probabilities on month-by-month basis. Our analysis reveals the "roller coaster of expectations" on the capital market over the past 14 months: Market participants started the crisis year with positive economic expectations. By February 21, 2020, the state probability for a recession was below 10% and correspondingly for an expansion above 90%. On February 24, however, the expectations change significantly: with the global spread of COVID-19 and the official declaration of a pandemic by the WHO on March 11, the state probability for a recession rises almost explosively and reaches a value of 100% on March 16. This is related to significant changes in three of the four state variables in response to the completely new situation last spring: The U.S. TED spread jumps from levels around 0.1% to over 1.5%, the U.S. credit spread rises from levels around 2.4% to over 4.3%, and the VIX index soars from below 20% to over 80%.

While the complexity of the crisis is rapidly increasing, the large fiscal rescue packages and the flood of liquidity from central banks cause the traded probability of a recession to fall back to around 60% already in May 2020 and to around 50% in the summer (mid-August). The growing risk of a second wave of infections increases the probability of a recession back up to values well above 80% in fall 2020, before good news from highly relevant areas brightens investors' expectations. The outcome of the U.S. election (Joe Biden's electoral victory on November 7) and the positive news about successes in vaccine development (e.g. the press release from BioNTech/Pfizer stating a successful interim analysis on November 9) cause the state probability for a recession to decline to values around 50% in the course of November - and this is how 2020 ends.
Nevertheless, in the first two months of 2021, the regime on the capital markets is again more fragile. On the one hand, global reports of problematic virus mutations are arising, while on the other hand, more and more effective vaccines are being approved. The tension is complemented by mixed reports from the economy, causing the traded state probability for a recession to fluctuate in the range between 46% to 85%.
Conclusion
Although the pandemic brought the global economy into an unparalleled recession, which was confirmed by global organizations such as the IMF and national institutions such as the NBER, the capital markets always had a very differentiated view of what was happening. Market participants have always weighed the course of the health crisis and the immediate enormous economic consequences against (a) the expected effects of fiscal and monetary policy measures to stabilize the situation and (b) the prospects of successfully containing the spread of the virus through vaccines. Doing so, the capital markets anticipated the future with their characteristically broad view.
We wanted to demonstrate that quantitative analyses of market data can support a differentiated view of events in an overwhelming stream of news and media. Selected market data enables us to understand expectations of market participants that can be derived from their actions. Ultimately, traded expectations have a particularly high information value. On the last trading day of February 2021, our estimated state probabilities suggest that market players are currently operating more under the expectation of a recession. It therefore seems like despite many positive developments, the situation has currently not yet relaxed.
(1) The NBER defines: “A recession is a significant decline in economic activity spread across the economy, normally visible in production, employment, and other indicators.”
(2) In our Market Insights last year, we repeatedly referred to these state variables to classify the development of the situation.
(3) The following recessions are in the analysis period: August 1990 to March 1991, April 2001 to November 2001, January 2008 to June 2009, and the current phase since March 2020.
Author
Dr. Peter Oertmann | Chairman of the board
oertmann@ultramarin.ai
Data analysis
David Dümig | Senior Quantitative Investment Researcher
duemig@ultramarin.ai
Appendix